Feeds:
Posts
Comments

There are three pillars that matter in project management, task management, time management and team management. A good project manager should always have the latest and greatest truth about who is working on what and for how long. In the other hand, a good project management tool should help answer these questions in a simple and effective way. There are numerous project management tools out there, a good part of these tools are utterly complicated! It took me more than a minute to add a simple task to my project. Other tools are too simple. Some of these simple tools have things like due dates on tasks which is not good enough as I can’t get a clear answer on what is left to do on my various projects. After some time wondering around looking for a tool that fits my needs, I decided to go on and write a tool that will suite me best. So I came up with the Online Task Manager which I am using to organize my everyday work and other various projects I have. The tool can be found at https://www.online-task-manager.com

picture

Online Task Manager organizes your tasks into Projects. Every project is board that contains lists. Every list is a set of tasks. You can have as many lists as you wish. Every list contains as many tasks as you want. Tasks can be dragged from one list to the other.

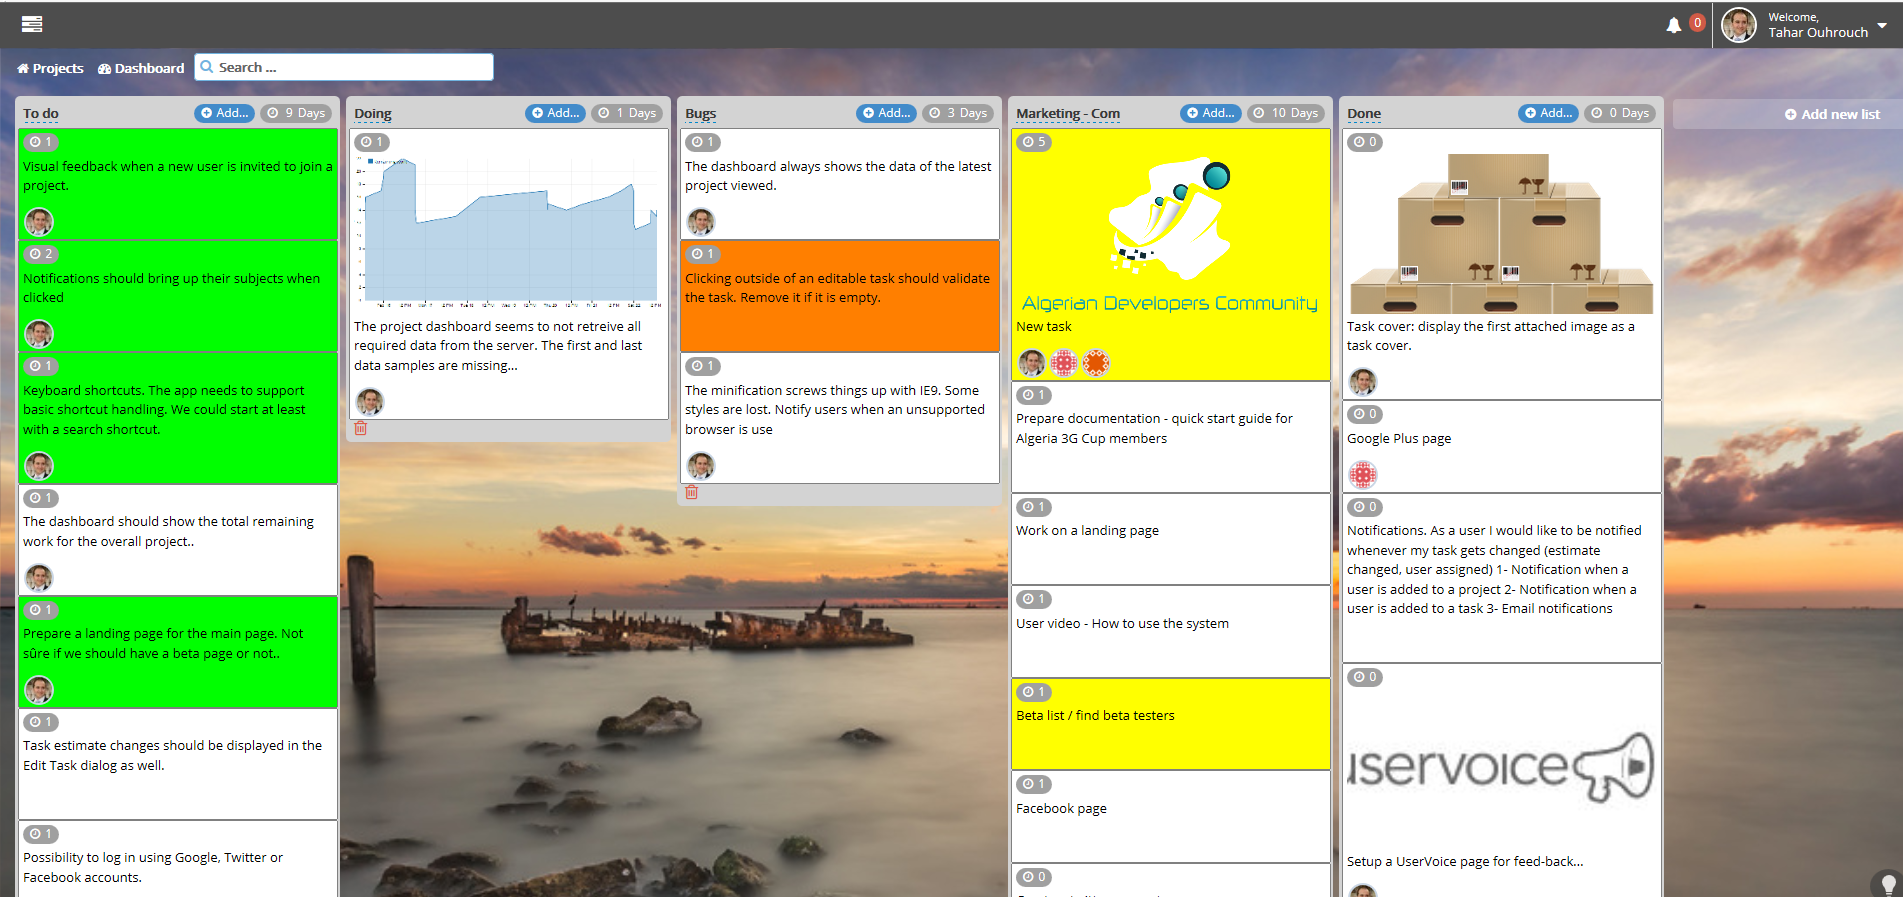
You first need to register into the system. Once in, you will be directed into your main work area as shown in the picture above.

createProject

Start by creating a new project, enter your project main information such as a title, a description and how would you like to track your time spent on this project. Work measurement can be days, hours, weeks, months or anything else that can represented as a number. At the bottom of the page, the system gives you the ability to add new team members into your project. The system is smart enough to look at your other projects and propose to add team mates you have on other project into the current one. You can always invite new team members via email, just enter their email and we will take care of the rest. Added members will be added to your project and can be assigned tasks straight away. Even before they register into the system.

Once your project is created, click on open to open the project board. There are three lists that we create for you by default, “To do“, “Doing” and “Done” you are free to rename these lists to anything you want. We also offer you a possibility of adding a new lists at your will.

taskBoard

To edit a task, click on it, the following dialog will pop up.

taskDialog

This dialog allows you to:

  • Change a task title
  • Change a task color
  • Assign new team members
  • Attach files

The board also offers a powerful instant search. Enter any text into the search box and all tasks will be filtered instantaneously.

Note that changes made on your project will be automatically reflected on all your colleagues computers, the changes propagate instantaneously.

Online Task Manager also gives your the ability to view your project’s timing measurements. As mentioned earlier, every project has an estimation / work unit which can be days, hours, weeks, months or anything else that can represented as a number. Every task has an estimate. Tasks and task lists display their remaining work efforts, this gives you plenty of possibilities as to measuring how much work is left in every category

To view your project dashboard, click on the Dashboard button at the top of your board. This will bring up a graph showing effort spent up to the current date. You can filter out the graph and see who changed what and how.

dashboard

Note that Online Task Manager is now in a beta phase, we would be more than happy to have you give us a try and let us know what you think and how we can change our system to fit your needs.

Some days ago I read  Jon Skeet‘s twitter post on NCrunch and thought I would give it a try.

The idea of running unit tests right from the IDE without having to call NUnit or any other third party testing framework seems interesting.

To test NCrunch, I reused my GIS solution that has some unit tests.

  • Opened my solution in VS 201o
  • Enabled NCrunch from VS 2010 main menu
  • NCruch wizard popped up

At this point, I had to go back to the code as I needed to do some modifications before running the wizard. Unfortunately that was not possible as the wizard is a modal dialog so I had to cancel it.

Once my modifications on the code done, I tried to go back and open the wizard again by disabling and then enabling NCrunch.

That did not have any effect and I could not reopen the wizard.

As I could not get the wizard back for my GIS solution, I decided to go for a new project from scratch.

Enabling NCrunch for a new project does not work either, not sure but I was expecting the wizard to open for every new solution created within VS2010.

Anyway, the tools looks very simple and easy to configure… trying without the wizard!

I created a test project that contains a simple class that does some math operations, the example below is a method that adds up two integer numbers and returns the result.

public class MathOperations {
   public static int Add(int i, int j) {
       return i+j;
   }
}
[TestFixture]
class MathOperationsTest {
    [Test]
    public void TestAddition() {
        Assert.AreEqual(2, MathOperations.Add(1, 1));
    }
}

Note that if you want to have your tests automatically executed , you need to “enable automatic test execution” from the main NCrunch menu.

NCrunch shows you the test results straight in the IDE which is awesome! No need to go anywhere else to see your results as they will be there sitting right in front of you along with the production code!

The tool uses the standard colors to highlight test results, all successfully tested lines are marked in green, and that happens in real time!

Up to this point, the tool looks great, so far so good! Time to push it a bit into the limits…

For this purpose, the addition method showed above is rewritten using recursion, which involves a more complex execution path and more resources.

   public static int Add(int i, int j) {
      if (j == 0) return i;
      return Add(i+1, j-1);
   }
   [Test]
   public void TestAddition() {
      Assert.AreEqual(300, MathOperations.Add(100, 200));
   }

The resulting output is a bench of green dots, meaning that the production code is doing what it is supposed to do.

Changing the unit test to the following :

   [Test]
   public void TestAddition() {
      Assert.AreEqual(2, MathOperations.Add(1000000, 500000));
   }

Gives… A crash 😦

In this situation, it is preferable for the tool to show a dialog box warning the user of a memory exception rather than crashing.

To wrap up this post, some points to be highlighted:

The good 

  • NCrunch is an excellent tool that helps you test your code without having to leave your IDE. This will save you a couple of clicks and that is something like 5 seconds of your precious time for every test execution you perform
  • There are many other useful features available not covered in this post, check out  NCrunch web site for more details

The bad

  • The tool being in its beta release, there are still some reliability issues that need to be fixed

Still in the process of trying out this tool, I will post any other findings I do while testing my different sized projects.

Happy testing!

On the way of introducing a compass to my GIS prototype, I came across an implementation idea that I would like to share.

Well structured and designed applications often separate user interface and domain business layers. Data binding is one of the great means introduced in WPF that aims and helps developers efficiently decouple their user interfaces from the rest of the application.

The following XAML code creates a window containing a slider and an image control. The idea is to rotate the image by a rotation angle given by the slider control.
<Window x:Class="Exercises.MainWindow"
xmlns="http://schemas.microsoft.com/winfx/2006/xaml/presentation"
xmlns:x="http://schemas.microsoft.com/winfx/2006/xaml"
Title="MainWindow" Height="278" Width="356">
<StackPanel Name="stackPanel">
<Label Content="{Binding ElementName=slider, Path=Value}" Height="28" Name="label1" />
<Slider Name="slider" Height="23" Margin="12,58,0,0" Width="307" Maximum="360" ValueChanged="slider_ValueChanged" />
</StackPanel>
</Window>

If you are coming from WinForms world, you would capture the ValueChangedEvent of the slider and do the following:

private void slider_ValueChanged(object sender, RoutedPropertyChangedEventArgs<double> e) {
   double rotationAngle = slider.Value;
   stackPanel.Children.Remove(compassDrawing);
   compassDrawing = DrawImage(rotationAngle);
   stackPanel.Children.Add(compassDrawing);
}
UIElement DrawImage(double rotationAngle) {
   // Create a 100 by 100 image with an upper-left point of (75,75).
   ImageDrawing compassImage = new ImageDrawing();
   compassImage.Rect = new Rect(0, 0, 200, 200);
   compassImage.ImageSource = new BitmapImage(
    new Uri(@"D:\Documents\Visual Studio 2010\Projects\Exercises\Exercises\Images\compassImage.png", UriKind.Relative));
    // Use a DrawingImage and an Image control to display the drawing.
    DrawingImage drawingImageSource = new DrawingImage(compassImage);
    // Freeze the DrawingImage for performance benefits.
    drawingImageSource.Freeze();

    Image imageControl = new Image();
    imageControl.Stretch = Stretch.None;
    imageControl.Source = drawingImageSource;
    imageControl.RenderTransform = new RotateTransform(rotationAngle, compassImage.Rect.Width/2, compassImage.Rect.Height/2);
    // Create a border to contain the Image control.
    Border imageBorder = new Border();
    imageBorder.Child = imageControl;
    return imageBorder;
}

The slider_ValueChanged event handler will replace the previous image in the main stack panel by a newly generated image. The DrawImage() method will draw a new rotated image given an angle as a parameter.

Figure 1 : Non rotated image

Figure 1 shows a non rotated image that is shown either at application start up or when the slider’s value is set to 0 or 360 degrees.

Figure 2 in the other hand shows the result when the slider is set to a given value:

Figure2: Rotated image

If we look back to the code now, there is clearly a smell of a binding possibility out there!

The compass image can have a property, say Rotation which, whenever changed, the image rotates automatically without involving event handlers.

Looking to the UI controls used above, none of them supports this functionality. A great opportunity for us to do some custom data binding.

WPF vs HTML5

An interesting question a friend of mine asked a couple of days ago on Twitter, would HTML5 beat WPF?

In this short post, I’ll try to answer this question and share my personal thoughts on this very interesting matter. One thing I would like to mention here is that my knowledge in WPF, HTML5 are not strong and wide enough to compare these two domains, that’s why I will be speaking my opinion from a technology point of view not technical.

In my mind, no technology is lasting forever. Our excitement for today’s innovations will fade away tomorrow as the industry involves and new technologies come to market. Just think for a second, how excited were you the day you learned that MS is releasing a new Win32 technology called MFC and how disappointed were you when you got the sad news of MS letting down MFC for other technologies such as WinForms? Every technology comes and makes a lot of success in a defined era and then goes away. This being said, I am pretty sure many WPF principles and paradigms sush as MVVM, data binding, UI/domain layers decoupling can be reused in different technologies. One thing for sure, HTML5 might have a chance to knock down WPF but that will only happen on the web development ring, standalone applications can still be built with this later technology and have a great success on the market.

The most important part of my drawing engine is almost done. In this post, I will talk about a coding mistake that took me almost a day to resolve hoping this will save some precious time to others. I spent a couple of hours adding a new renderer to my GIS application capable of drawing custom data layers. Done with implementing all drawing steps and got to display the final result and… Nothing on the screen!

Here is a code sample, part of the new rendering class

public DrawingVisual Render(Geometry geo){
      DrawingVisual drawingVisual = new DrawingVisual();
      DrawingContext drawingContext = drawingVisual.RenderOpen();
      // Draw geometry
      drawingContext.DrawGeometry(Brushes.Red, new Pen(Brushes.Blue, 2), geom);
      return drawingVisual;
}

This bit of code does obviously not work! Every thing seems to be right in place but something hidden somewhere is wrong making the shapes not to appear on the screen.
In fact, there was one line missing! The drawing context was left open and that is the reason why my drawings were not reflected on the screen.
I fixed the issue by adding the following line at the end of the “Render” method.

      drawingContext.Close();

Hi,

Now that I could see a visual representation of my project, next is sharpening the architecture and design of the application.

One design pattern that comes  very often when reading about WPF is MVVM (http://en.wikipedia.org/wiki/Model_View_ViewModel). I used this pattern and separate my GUI business from my domain objects, I struggled a bit at the beginning but finally managed to get something out.

Before moving to the steps taken to get an MVVM architecture out of my application, let’s have a quick look at the current implementation. In my previous post I directly used the map object from SharpMap and displayed it in the GUI as an image:

1- Load a shape file using SharpMap API

2- Render the shape file into an image

3- Use the resulting image and display it directly in the main window

Here is the pieces of code used for this purpose

// Event handler for button click
public void OpenShapeFileClicked(object sender, EventArgs e){
      // ... ask the user to provide a shape file using a file open dialog control
      LoadShapeFile(path_provided_by_user);
}
public void LoadShapeFile(string fileName){
      SharpMap.Layers.VectorLayer myLayer = new SharpMap.Layers.VectorLayer("ShapeFiles");
      myLayer.DataSource = new SharpMap.Data.Providers.ShapeFile("path_to_file", true);
      myLayer.Style.Fill = System.Drawing.Brushes.GreenYellow;
      myLayer.Style.Outline = new System.Drawing.Pen(System.Drawing.Brushes.Gray);
      myLayer.Style.Line.Width = 2;
      myLayer.Style.Line = new System.Drawing.Pen(System.Drawing.Brushes.Black);
      myMap.Layers.Add(myLayer);
      myMap.ZoomToExtents();
      DrawImage();
}
private void DrawImage(){
      // Convert System.Drawing.Image to ImageSource to wich an image is bound
      using (System.Drawing.Bitmap bitmap = new System.Drawing.Bitmap(myMap.GetMap())){
             IntPtr hBitmap = bitmap.GetHbitmap();
             // Use System.Windows.Interop.Imaging.CreateBitmapSourceFromHBitmap
             BitmapSource bitmapSource = CreateBitmapSourceFromHBitmap(
                hBitmap,
                IntPtr.Zero,
                Int32Rect.Empty,
                System.Windows.Media.Imaging.BitmapSizeOptions.FromEmptyOptions());
             image1.Source = bitmapSource;
      }
}

This is the usual way most programmers will do and especially those writing WinForms applications. Obviously not  the way to go as the domain code is linked to the GUI which makes it very hard to read and maintain.

What we want here is certainly not coupling the GUI with the business domain layer. In order to achieve separation of concerns, we will make use of the MVVM pattern and data binding.

Before looking on how to bind the map to the main GUI, let’s first have a look at the different artifacts of the application and where do they fit in MVVM:

Model : the map data structure, contains GIS data organized in layers as per the GIS simple feature specifications

View : a very thin layer communicating directly to the WPF main window

ViewModel: A new class that is introduced to separate the view from the model

Let’s see this pattern in action in a real life example: loading shape files! Let’s look at how shape files are loaded after moving the application’s architecture to MVVM.

The main control worth mentioning here is the Canevas that will hold the map. This control is updated upon model change notifications.

In order to be aware of all domain objects data changes, the main window will subscribe to change notifications coming from the map model (domain objects):

// Listen to model changes
mapView.PropertyChanged += new System.ComponentModel.PropertyChangedEventHandler(MapViewModelPropertyChanged);

This bit of code is placed on the main window constructor. This is a simple way of subscribing to all model data changes, albeit not a perfect one ( WPF encourages binding to the model directly on the XAML)

The ‘Load shape file’ button on the main window is bound to a command on the view class that will take care of loading all needed data

public ICommand LoadShapeFileCommand {
 get {
   if (loadShapeFileCommand == null) {
        // Use Lambda calculus to run the proper method when this command is applied
        loadShapeFileCommand = new GenericCommand(param => LoadShapeFile(), param => (mapViewModel != null));
   }
   return loadShapeFileCommand;
 }
}

The command patter used relies on Josh Smith’s relayCommand implementation (http://msdn.microsoft.com/en-us/magazine/dd419663.aspx)

The shape file is loaded as previously done, using SharpMap API. The map rendering is however now done in a different way using WPF rendering services instead of GDI+.
public void LoadShapeFile(string shapeFileName) {
      ...
      // The model has changed, notify the GUI of the change
      PropertyChangedEventArgs args = new PropertyChangedEventArgs("MapSnapshot");
      PropertyChanged(this, args);
}

The PropertyChanged event will end up in the main window.

        private void MapViewModelPropertyChanged(object sender, PropertyChangedEventArgs args) {
            string propertyName = args.PropertyName;
            if (propertyName == "MapSnapshot") {
                // Map snapshot has changed, reload it
                canvas1.Children.Clear();
                canvas1.ClipToBounds = true;
                canvas1.Children.Add(mapView.MapDrawing);
            }
        }
When doing this, watch out to properly setup the property name that has changed in the PropertyChangedEventArg. This is very important as it helps identify which part of the model did change (needs redrawing)
As you can see from the above code snapshot, the Canvas is updated by adding “mapView.Drawing” visual elements into its children.
public class MapView : FrameworkElement, INotifyPropertyChanged, IDisposable {
        private System.Windows.Media.VisualCollection children;
        ....
        public UIElement MapDrawing {
            get {
                return GetMapDrawing(mapViewModel.map);
            }
        }
        private UIElement GetMapDrawing(Map map) {
            children.Clear();
            VectorRenderer.map = map;
            foreach (SharpMap.Layers.ILayer layer in map.Layers) {
                // Render layer into layer drawing
                System.Windows.Media.DrawingVisual layerDrawing = VectorRenderer.Render(layer, map.Envelope);
                // Add rendered layer into drawing group
                AddVisualLayer(layerDrawing);
            }
            return this;
        }
        private void AddVisualLayer(System.Windows.Media.DrawingVisual visualLayer) {
            children.Add(visualLayer);
        }

As the rendering engine I’m working on these days is still “work in progress” only vector data can be rendered.

In this post, we have been through the main steps taken to put the MVVM pattern in action.

I also made some progress on writing my own WPF rendering engine which seems to do the work as expected. (see screenshot below)

Next, I’ll try to improve the rendering engine to support drawing other layer types, stay tuned…

WPF is making a lot of noise these days, I was wondering what this new technology is all about and decided to give it a try.

Coming from WinForm world, describing GUIs in text (XAML) seemed awkward to me, I struggled a bit  getting my first window up and running but managed to do so at the end.

In order to understand what is laying underneath WPF, I thought I should write my proper user control that can display something like a map.

Here is a screenshot of my first attempt to write such a control.

This control is based on SharpMap (http://sharpmap.codeplex.com/), reads and displays ESRI shape files.

For now, I am using SharpMap as it is. All what I did is to use the library, load some shape files and display them in an image control.

// Event handler for button click
public void OpenShapeFileClicked(object sender, EventArgs e){
      // ... ask the user to provide a shape file using a file open dialog control
      LoadShapeFile(path_provided_by_user);
}
public void LoadShapeFile(string fileName){
      SharpMap.Layers.VectorLayer myLayer = new SharpMap.Layers.VectorLayer("ShapeFiles");
      myLayer.DataSource = new SharpMap.Data.Providers.ShapeFile("path_to_file", true);
      myLayer.Style.Fill = System.Drawing.Brushes.GreenYellow;
      myLayer.Style.Outline = new System.Drawing.Pen(System.Drawing.Brushes.Gray);
      myLayer.Style.Line.Width = 2;
      myLayer.Style.Line = new System.Drawing.Pen(System.Drawing.Brushes.Black);
      myMap.Layers.Add(myLayer);
      myMap.ZoomToExtents();
      DrawImage();
}
private void DrawImage(){
      // Convert System.Drawing.Image to ImageSource to wich an image is bound
      using (Bitmap bitmap = new Bitmap(myMap.GetMap())){
             IntPtr hBitmap = bitmap.GetHbitmap();
             // Use System.Windows.Interop.Imaging.CreateBitmapSourceFromHBitmap
             BitmapSource bitmapSource = CreateBitmapSourceFromHBitmap(
                hBitmap,
                IntPtr.Zero,
                Int32Rect.Empty,
                BitmapSizeOptions.FromEmptyOptions());
             // Set image1 control data source
             image1.Source = bitmapSource;
      }
}

This project is not about rewriting a new SharpMap library for WPF but rather build up a WPF application from scratch based on SharpMap which I strongly believe will give me a great insight of the WPF technology and how GIS applications work.

In this little introduction, we demonstrated how easy it is to create a basic GIS application using WPF.

To be continued…